After creating a new chart layout you are going to want to add some indicators that you normally use with your trading strategies. In this article we will go over how to add some of the basic indicators to a chart. For each chart layout you can have different indicators. For one chart layout you can have the indicators on it you might use when you are looking to swing trade a stock. Or you can have another chart with the indicators you use while you are day trading or even a different chart for trading Crypto.
Add the Volume Indicator
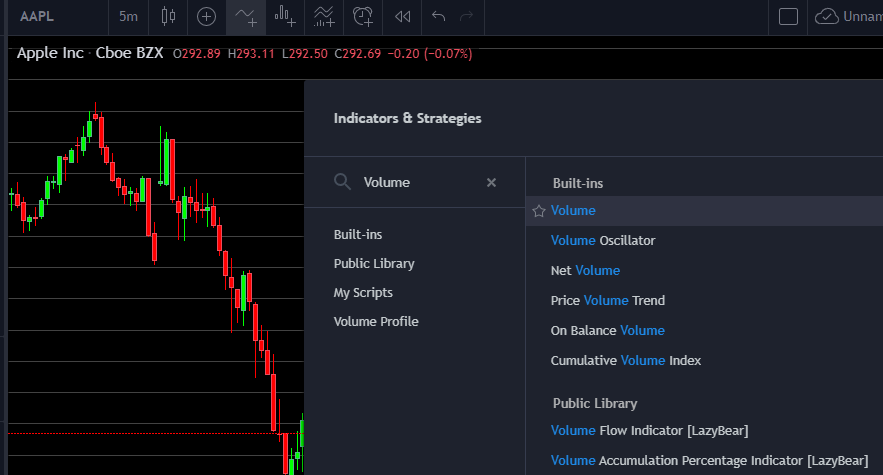
To add the volume indicator to your chart you just have to click on the highlighted icon above for “Indicators & Strategies” or you could just type the forward slash key “/”. This will open a window in that chart that will have a search for the indicator you would like to add to the chart. Type in volume next to the magnifying glass and the list will filter to find all of the indicators that have the word volume in their name. Just select where it says volume on the right and this will add the volume indicator to your chart.
Add the Relative Strength Index
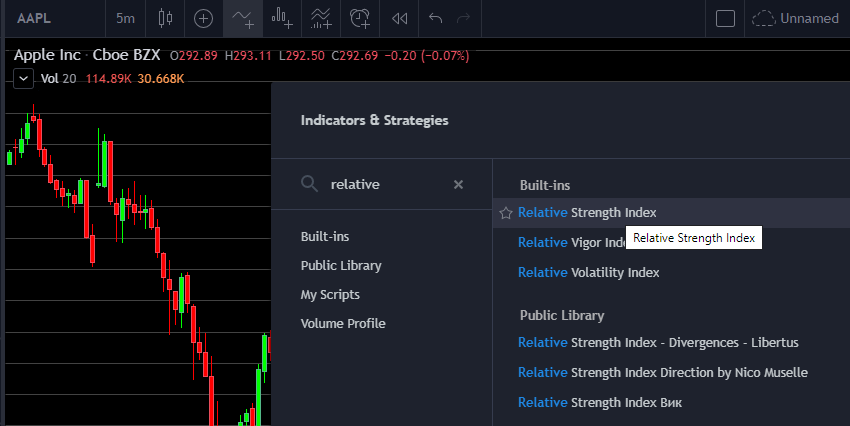
Now open up the “Indicators & Strategies” window and begin typing in relative and it will begin to filter the list and you will see the RSI indicator come to the top of the list. Select that Relative Strength Index and it will now be added to your chart as well.
Add the Moving Average Indicator
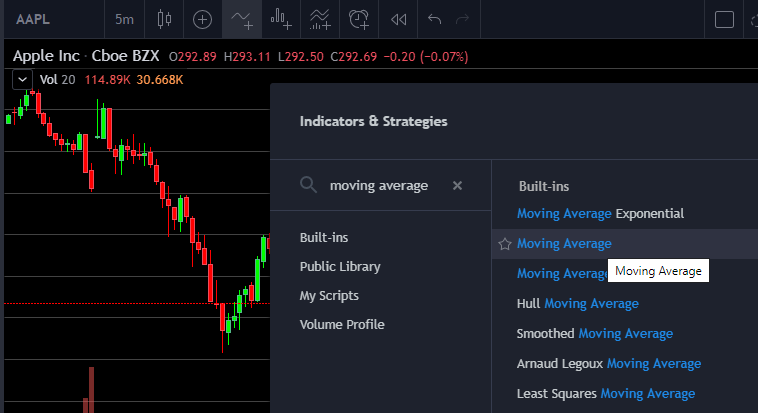
Now open up the “Indicators & Strategies” window one more time and begin typing in moving average. You will begin to see the list filter and you will see Moving Average select that one to add it to your chart.
Indicator Settings
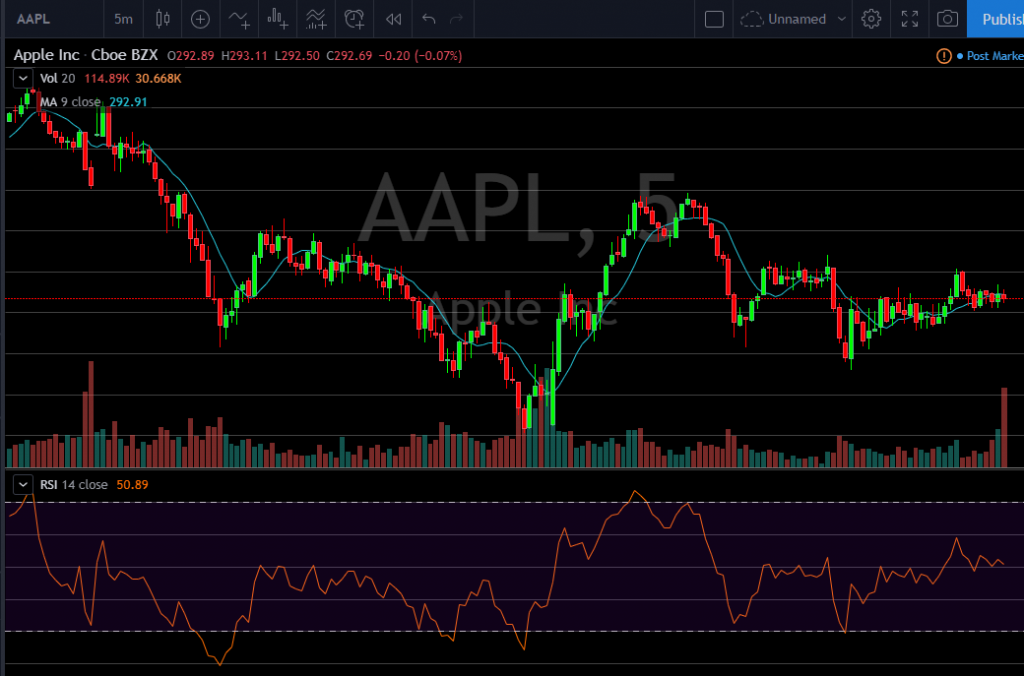
Now your chart should look like the one above with the 3 indicators that we just added to it. After you have the indicator on your chart you are able to hover over the indicator and you will see a settings gear icon. When you click on that icon it will bring up the settings for the Indicator.
Moving Average Settings
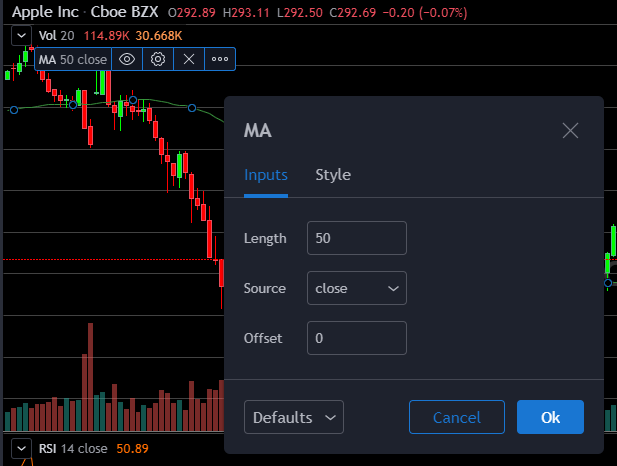
For the Moving Average indicator you are able to adjust some of the settings to your liking. You can change the color of the MA and also the length, source and offset. If you would like to have a 50 day moving average just change the length to 50 and click Ok. If you would also like to have the 200 day Moving Average just add another MA indicator to the chart and then you can change the length to 200 and also give it a different color to be able to tell the difference between the two indicators. You can play around with the setting for each indicator. The RSI indicator has quite a few settings you are able to change the color of the line and also set length, source, the Upper and Lower Band Limits
Indicators Per Chart
The amount of indicators on a chart are one of the things that TradingView limits depending upon the plan that you are subscribed to. Below is a graphic from TradingView.com about the amount of indicators you get to put on a chart per plan.

On the Basic/Free Plan TradingView limits you to only 3 indicators per chart. This is not very many indicators to have on a chart. If that is not enough indicators for your strategies you are following you are going to want to take a look at one of the paid plans to be able to add more indicators to your charts. Click here to go to TradingView to sign up for the Pro Plan that allows for you to have 5 indicators per chart.
* Some of the links above are affiliate links, which means that if you choose to make a purchase, I will earn a commission. This commission comes at no additional cost to you.
